Nwaokocha Michael
A Web Developer with experience building scalable web and mobile applications. He works with React, TypeScript, Golang, and Node.js, and enjoys writing about the patterns that make software easier to understand. When not debugging distributed systems or writing articles, you can find him reading sci-fi novels or hiking.
Article by Gigson Expert
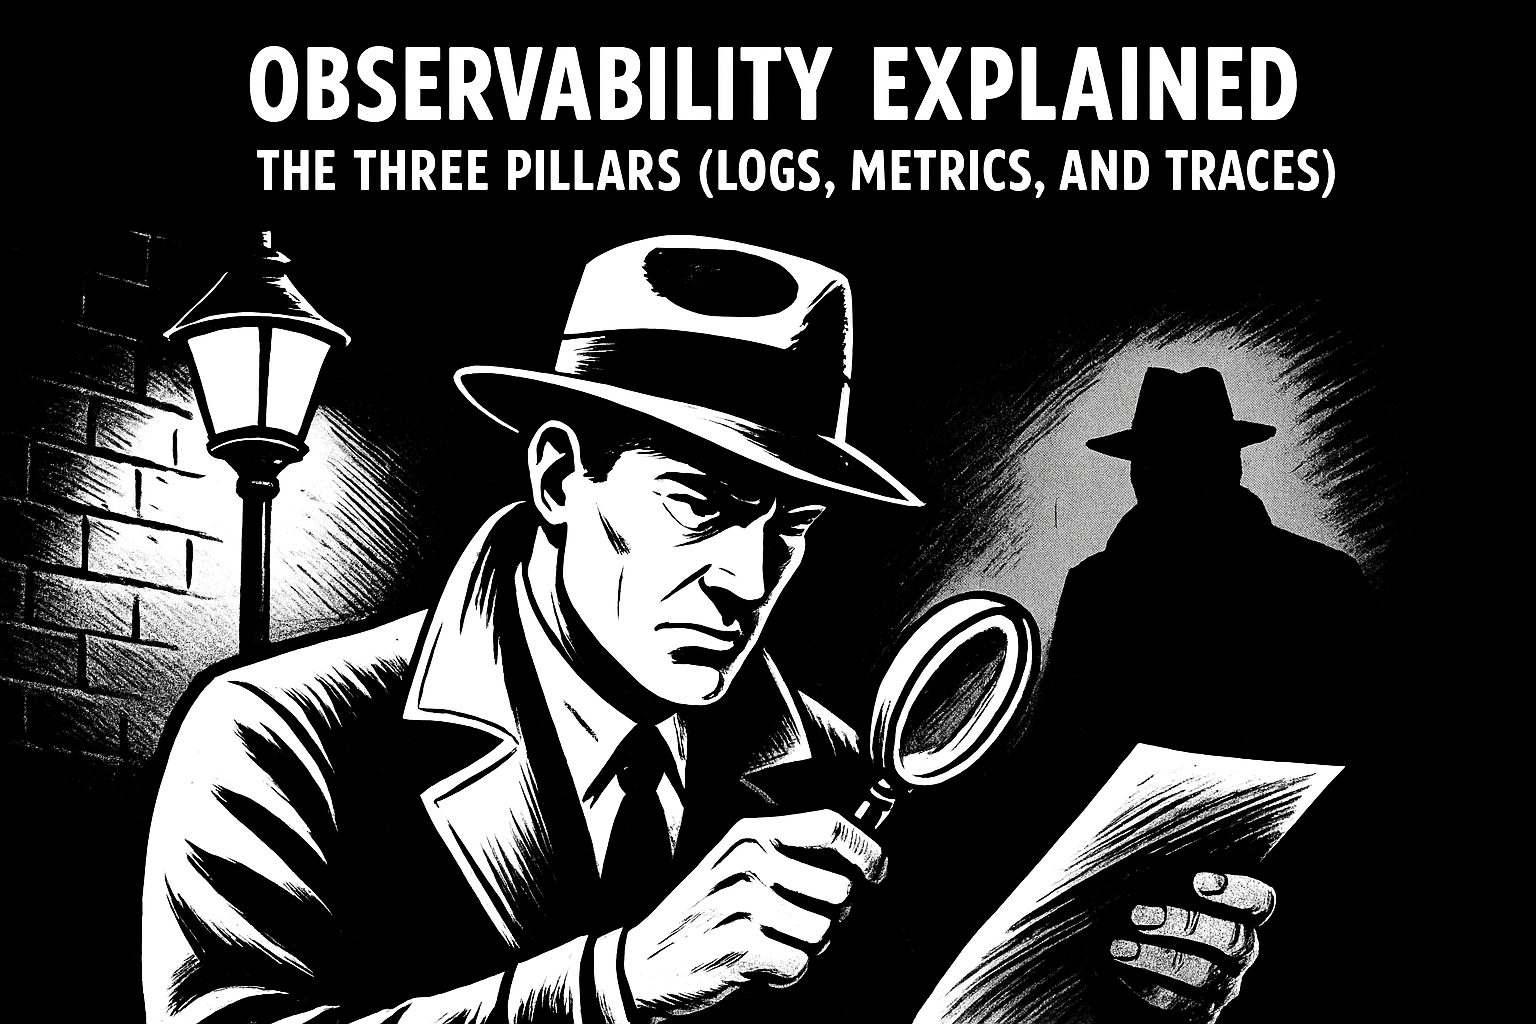
Here's something interesting: thousands of years ago, our ancestors could spot a predator hiding in tall grass just from a tiny bit of movement. They could look at clouds and know if rain was coming. They could glance at someone's face and tell if they were getting sick.
We didn't survive as a species because we were stronger or faster than other animals. We survived because we got really good at noticing patterns.
Jump to today, and we're still doing the exact same thing. Just in a different world. Instead of watching for danger in the grass, we're hunting down bugs in our software. Instead of tracking animals, we're tracking down system failures. The setting changed, but our brains? They're still doing what they've always done best.
And that's the key behind observability.
When people talk about observability, they usually jump straight to tools: logs, metrics, traces, dashboards, and APM. But I think that we need to acknowledge the human element. Observability isn't really about the tools. It's about making our software systems visible so our brains can do what they're already great at: spotting when something looks wrong.
Think of it like this: every bug, every system failure, every weird performance issue is a crime scene. Something happened. Something broke. And you need to figure out what went down. Observability is your detective toolkit. Logs are your witnesses. Metrics are your surveillance cameras. Traces are your forensic evidence showing exactly how the crime unfolded.
In this article, I want to walk through what observability actually means, why we need it, and how it works with the pattern-spotting superpowers we already have. And more importantly, I want to show you what it looks like in real code, because that's where the crimes actually happen.
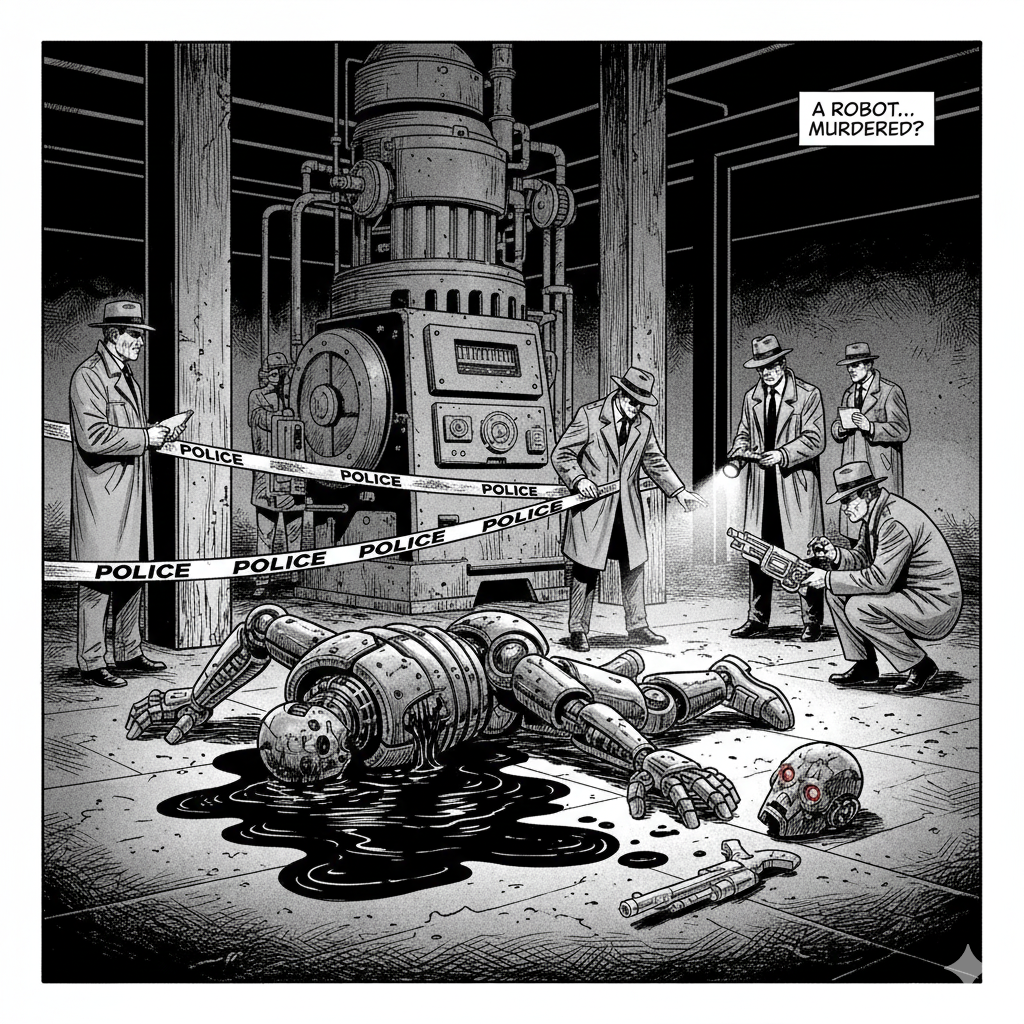
The Crime Scene: Software We Can't See
Let's start with why this matters at all.
Imagine you built a simple website. It's running on one computer somewhere. Something goes wrong, and the site gets slow. What do you do? You probably log into that computer, check what's using up the memory or CPU, and look at some error messages. The whole crime scene is small enough that you can kind of picture it in your head. It's like investigating a break-in at a small shop. You can see everything.
Now imagine something different. Your website is actually 50 different pieces of software, all talking to each other. They're spread across different cloud servers. Some of them start up and shut down automatically based on traffic. A single person clicking "buy now" on your site might touch 10 different pieces before they see a confirmation page.
Now something goes wrong. Where do you even look? It's like investigating a crime where the suspect moved through a dozen different buildings, each with different security systems, and you have no idea which building they're in or what they did.
This is the reality of modern software. It's everywhere and nowhere at the same time. Crimes happen in the shadows. Users report that something's broken, but by the time you arrive at the scene, the evidence is gone. You can't just "look" at it the way you'd look at something physical. It's like trying to solve a case while wearing a blindfold.
Observability is about taking off that blindfold and lighting up the crime scene.
What Most Code Actually Looks Like (The Unsecured Crime Scene)
Let me show you something familiar. Here's what a lot of code looks like when you're just starting out or moving fast:
async function processOrder(orderId, userId) {
  const order = await db.getOrder(orderId);
  const user = await db.getUser(userId);

  if (order.total > user.balance) {
    return { success: false };
  }

  await paymentService.charge(user.paymentMethod, order.total);
  await db.updateOrder(orderId, { status: 'paid' });
  await emailService.sendConfirmation(user.email, order);

  return { success: true };
}
This looks clean, right? It works. But this is like a crime scene with no security cameras, no witnesses, and no forensic team. When something goes wrong, you've got nothing.
A user calls and says their order didn't go through, but they were charged anyway. That's your crime. But you have no witnesses, no surveillance footage, nothing. You're stuck trying to reconstruct what happened from memory and guesswork.
Or orders start taking 30 seconds to process, and you have no idea why. That's another crime. But without evidence, you can't solve it. You're just standing in an empty room, wondering what happened.

Enter Logs: Your Snitches on the Inside
Logs are the simplest place to start. They're like witnesses at a crime scene. They saw what happened, and they're willing to talk. But here's the thing: you don't want witnesses who never shut up about every tiny detail. You want witnesses who tell you the important stuff and keep it clean.
This is where structured logging comes in. Instead of having witnesses ramble on with console.log, you use a logging library that gives you organized, searchable statements. Let me show you what I mean using a library like Pino (popular in Node.js, similar concepts exist in every language):
const logger = require('pino')();

async function processOrder(orderId, userId) {
  logger.info({ orderId, userId }, 'Processing order');

  const order = await db.getOrder(orderId);
  const user = await db.getUser(userId);

  if (order.total > user.balance) {
    logger.warn({
      orderId,
      userId,
      required: order.total,
      available: user.balance
    }, 'Insufficient balance');
    return { success: false };
  }

  await paymentService.charge(user.paymentMethod, order.total);
  await db.updateOrder(orderId, { status: 'paid' });
  await emailService.sendConfirmation(user.email, order);

  logger.info({ orderId, userId }, 'Order processed successfully');
  return { success: true };
}
Now you've got witnesses. Not chatty ones who tell you every single thing they saw, but reliable ones who report the key moments: when the order started processing, when something went wrong, and when it finished successfully.
Notice the log levels? That's like witness reliability ratings. info is for normal stuff everyone should know about. warn is for "hey, something's off here, but we handled it." error is for "someone call a detective, this is bad." And debug (which we'll see later) is for the tiny details you only care about when you're deep in an investigation.
The logs are structured in JSON format, which means you can search by specific details. Looking for all crimes involving order #12345? Search for orderId: "12345". Want to see every time a user had an insufficient balance? Search for logs with level warn and message "Insufficient balance."
Now, when that user calls about the weird charge, you can interrogate your witnesses. Search your logs for their order ID and see exactly what happened. Did the payment go through? Did the order fail with a warning? Your snitches tell you everything.
Your brain loves this because it's a clean narrative. You read the witness statements top to bottom, and when something doesn't make sense, you spot it immediately. Maybe you see "Processing order" but never see "Order processed successfully." Now you know something went wrong in between. The crime is visible.
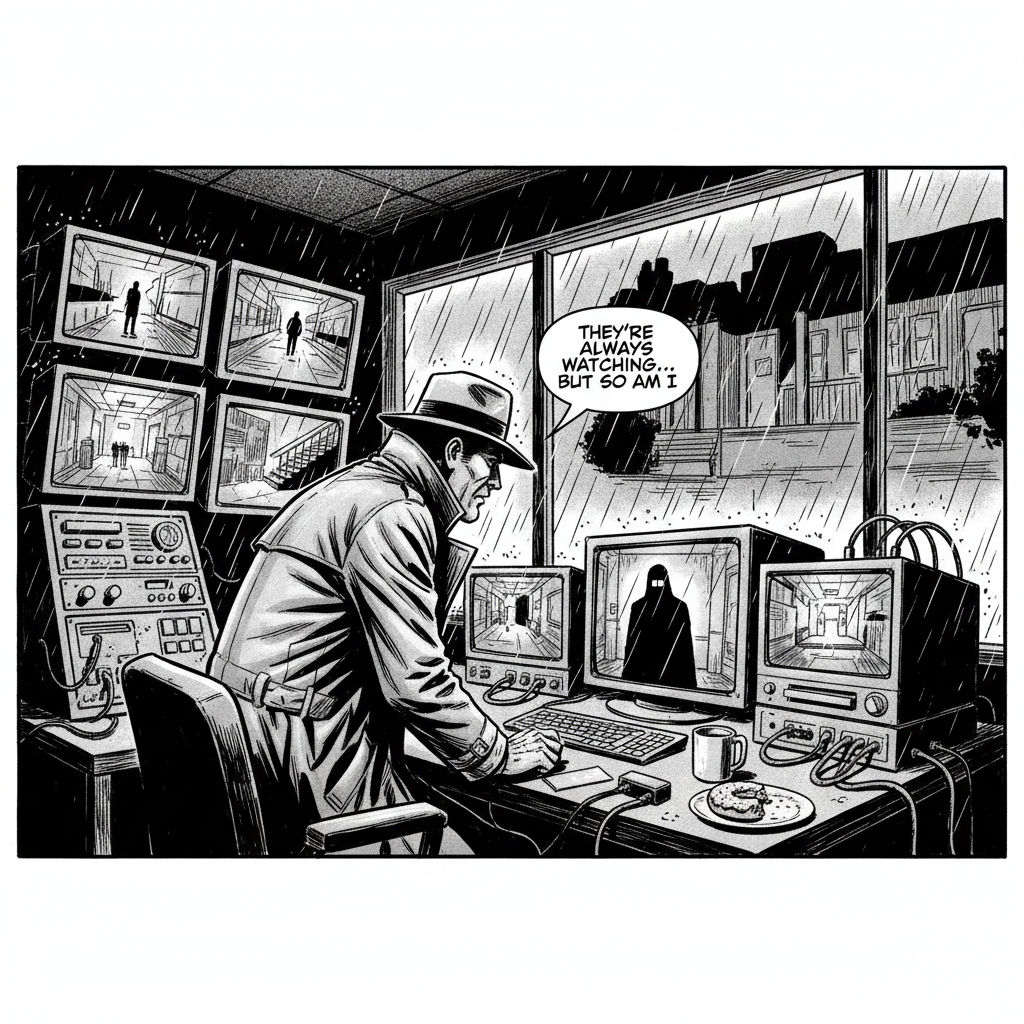
Surveillance Cameras: Understanding With Metrics
But witnesses alone don't show you the bigger picture. That's where metrics come in. Think of metrics as your surveillance camera system.
A witness can tell you what happened with one specific order. But surveillance cameras show you patterns across time. How many orders are coming through? How many are failing? How long is processing taking? Is there a pattern to when things go wrong?
Here's how you might add that surveillance system:
const logger = require('pino')();
const metrics = {
  ordersProcessed: 0,
  ordersFailed: 0,
  totalProcessingTime: 0
};

async function processOrder(orderId, userId) {
  const startTime = Date.now();

  try {
    logger.info({ orderId, userId }, 'Processing order');

    const order = await db.getOrder(orderId);
    const user = await db.getUser(userId);

    if (order.total > user.balance) {
      logger.warn({
        orderId,
        userId,
        required: order.total,
        available: user.balance
      }, 'Insufficient balance');
      metrics.ordersFailed++;
      return { success: false };
    }

    await paymentService.charge(user.paymentMethod, order.total);
    await db.updateOrder(orderId, { status: 'paid' });
    await emailService.sendConfirmation(user.email, order);

    metrics.ordersProcessed++;
    logger.info({ orderId, userId }, 'Order processed successfully');
    return { success: true };

  } catch (error) {
    logger.error({ orderId, userId, error }, 'Failed to process order');
    metrics.ordersFailed++;
    throw error;

  } finally {
    const duration = Date.now() - startTime;
    metrics.totalProcessingTime += duration;
    logger.debug({ orderId, duration }, 'Processing time recorded');
  }
}
Now you can check your surveillance footage over time and see patterns. If you normally process 100 orders per minute and suddenly it drops to 10, that's suspicious activity. If processing time is usually 200 milliseconds but suddenly jumps to 5 seconds, someone's messing with your system.
Your brain is incredible at spotting these patterns in surveillance footage. It's the same skill that lets you know when someone's walking suspiciously or when traffic patterns look wrong. You see a graph of these numbers over time, and the crimes just jump out at you. There's a spike, there's a drop, there's something that doesn't fit the normal rhythm.
This is pattern recognition at work, just applied to numbers instead of visual movement.
The Forensic Trail: Following the Path With Traces
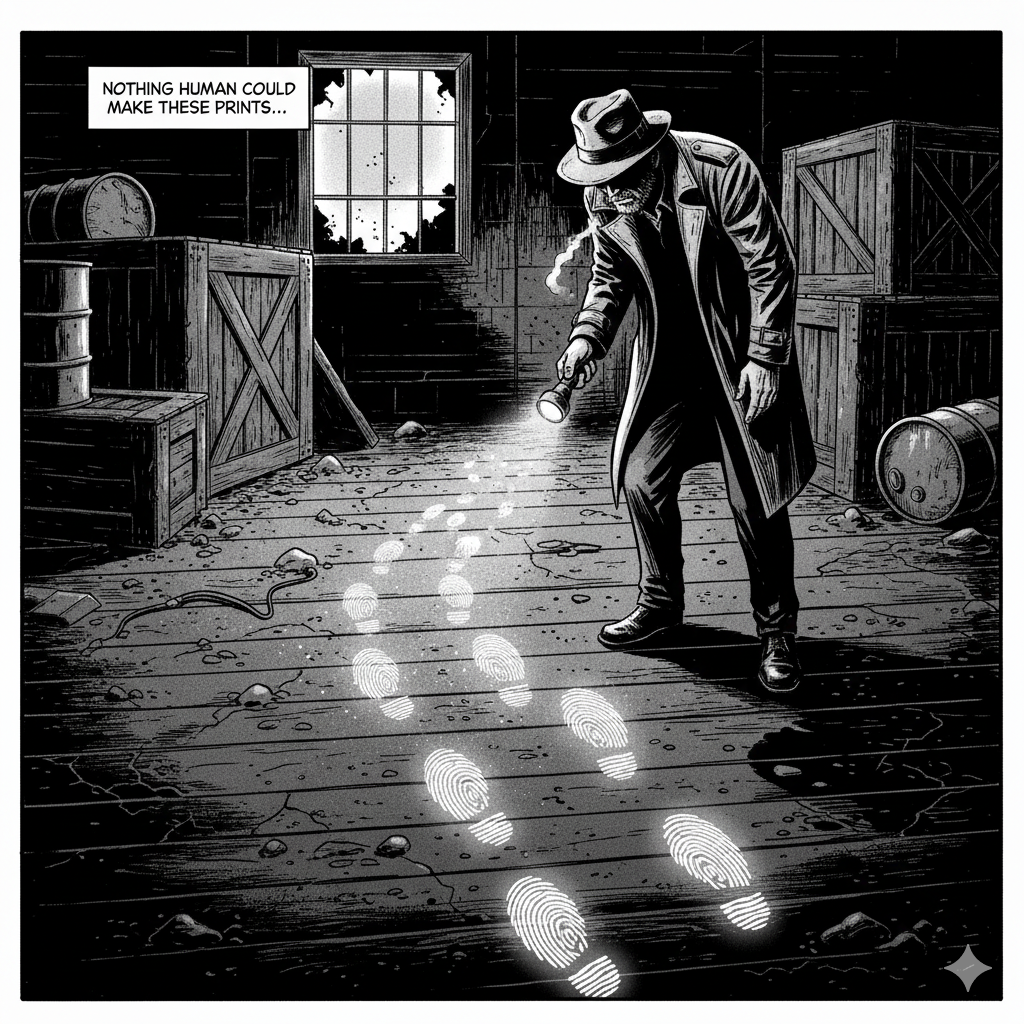
Now here's where things get interesting. In real systems, that processOrder function might call other services, which call other services, which call databases and APIs. When a crime happens, you need to see the complete forensic trail. Who did what, when, and where?
This is where traces come in. A trace is like following a suspect's movement through multiple buildings with security footage from each location, all timestamped and connected. You can see the entire journey.
Here's how you might set up that forensic system:
const logger = require('pino')();
const { randomUUID } = require('crypto');

async function processOrder(orderId, userId, traceId = randomUUID()) {
  const startTime = Date.now();

  // Create a child logger with the traceId - like tagging all evidence with a case number
  const log = logger.child({ traceId });

  try {
    log.info({ orderId, userId }, 'Processing order');

    const orderStart = Date.now();
    const order = await db.getOrder(orderId, traceId);
    log.debug({ orderId, duration: Date.now() - orderStart }, 'Retrieved order');

    const userStart = Date.now();
    const user = await db.getUser(userId, traceId);
    log.debug({ userId, duration: Date.now() - userStart }, 'Retrieved user');

    if (order.total > user.balance) {
      log.warn({
        orderId,
        userId,
        required: order.total,
        available: user.balance
      }, 'Insufficient balance');
      metrics.ordersFailed++;
      return { success: false };
    }

    const paymentStart = Date.now();
    await paymentService.charge(user.paymentMethod, order.total, traceId);
    log.debug({ orderId, duration: Date.now() - paymentStart }, 'Payment charged');

    const updateStart = Date.now();
    await db.updateOrder(orderId, { status: 'paid' }, traceId);
    log.debug({ orderId, duration: Date.now() - updateStart }, 'Order updated');

    const emailStart = Date.now();
    await emailService.sendConfirmation(user.email, order, traceId);
    log.debug({ orderId, duration: Date.now() - emailStart }, 'Confirmation sent');

    metrics.ordersProcessed++;
    log.info({ orderId, userId, duration: Date.now() - startTime }, 'Order processed');
    return { success: true };

  } catch (error) {
    log.error({ orderId, userId, error }, 'Failed to process order');
    metrics.ordersFailed++;
    throw error;

  } finally {
    const duration = Date.now() - startTime;
    metrics.totalProcessingTime += duration;
  }
}
See what happened there? Every log statement now has the same traceId, like every piece of evidence in a case gets tagged with the same case number. And notice the log levels: info for major events, debug for detailed forensic timing that you only look at during active investigations.
In production, you'd probably keep debug logs turned off to avoid too much noise. But when you're investigating a crime (a slow order, a failed payment), you can filter your logs by that specific traceId and temporarily enable debug level to see the complete forensic timeline.
Now, when you search your logs for that trace ID, you see the entire criminal timeline. You can see exactly where time was spent. Maybe retrieving the order took 50ms (normal), getting the user took 40ms (normal), charging the payment took 100ms (normal), but updating the database took 4 seconds (there's your perp). The forensic evidence points directly to the crime.
Our brains are built to understand cause and effect, to follow a story from beginning to end. Traces make that possible even when the story spans multiple systems. You can see the whole criminal path and instantly spot where things went wrong.
Why This Actually Matters
I know what you might be thinking: "This seems like a lot of extra work just to catch bugs." And you're right, it is extra work upfront. But here's the thing: bugs are going to happen anyway. The question is whether you spend 5 minutes reviewing your evidence to solve it, or 5 hours wandering around the crime scene, guessing what happened.
I learned this lesson the hard way. I once spent an entire weekend trying to solve a bug. A service kept failing silently, no surveillance footage, no forensic trail. Just me, desperately adding console.log statements (basically asking random people "did you see anything?") and rerunning over and over, hoping to catch something.
When I finally solved it (a context-mishandling situation), I realised I could have cracked the case in 10 minutes if I'd just had proper observability from the start. The evidence would have been right there. The witnesses would have told me exactly what happened. The surveillance footage would have shown me the pattern. The forensic trail would have pointed directly at the culprit.
That's when it clicked for me. Observability isn't overhead. It's your entire detective operation. It's the difference between investigating crimes with modern forensics and trying to solve them by wandering around asking random questions.
And here's the beautiful part: with log levels, you're not drowning in console statements. In normal times (production with info level), your logs only show major events. When a bug appears, you can turn up the sensitivity to debug for that specific case and get all the detailed forensic timing. Your system stays quiet until you need to investigate.

Building Your Bug Surveillance Agency
If you're working on a project right now without much observability, you don't need to build the entire detective agency at once. Start small. Start with logs(witnesses).
Pick your most critical function, the one that handles important user actions or processes key data. Add a structured logging library. In JavaScript/Node.js, Pino is great. In Go, there's Zerolog. In Python, you have structlog. In Java, there's Logback with JSON encoders. Every language has good options for getting reliable witnesses
Start by logging the key moments: when the function starts (function in progress), when it succeeds (function successful), and when it fails (failure detected). Use log levels appropriately: info for normal operations, warn for suspicious but handled situations, error for actual crimes, and debug for detailed forensic info you'll turn on during investigations. Include structured data (user IDs, order IDs, amounts) so you can search your witness statements effectively.
Then, if you're feeling ambitious, add some surveillance cameras. Track how long critical operations take. Count successes and failures. You don't need fancy monitoring tools at first, just simple metrics that you can check or expose via a basic endpoint.
The forensic trail (trace ID) might seem advanced, but it's actually pretty simple: generate a unique case number at the start of each request and pass it through your function calls. Use your logger's child logger feature to automatically include it in every witness statement. Then, when you're investigating a specific bug, you can filter by that case number and see everything related to that one incident.
You'll be amazed at how much this helps. The first time you solve a production crash in minutes instead of hours because you can actually see what happened, you'll never want to go back to investigating blind. And because you're using log levels properly, you're not drowning in logs. You see what you need to see when you need to see it.

The Detective's Brain
What I find fascinating about observability is that it's not really about the tools or the techniques. It's about working with how our brains naturally function as pattern detectives.
We're investigators by evolution. We've been doing it for millions of years. We spot when something doesn't fit the pattern. We notice when the story doesn't add up. We see the one thing out of place in a sea of normal.
Observability just gives us the evidence so those ancient detective instincts can kick in. Logs give us witness statements we can follow. Metrics give us surveillance footage showing patterns over time. Traces give us forensic trails showing exactly how crimes unfolded.
When you look at a dashboard showing your error rate spiking, you don't need to do complex analysis. Your detective brain just sees it. When you read through logs and spot the line that says "Database connection failed," you don't need an algorithm to highlight it. It jumps out at you like blood on a white carpet.
We're using modern tools to feed evidence to brains that evolved to solve survival mysteries in the Stone Age, and somehow it works perfectly. A bug is just a break in the pattern, and you're the detective with the pattern-recognition superpowers to catch them.
Closing the Case
From ancient hunters tracking predators to modern developers tracking bugs, we're still doing the same thing: we're detectives looking for patterns, noticing what's out of place, solving mysteries.
Because at the end of the day, that's what we do. We investigate. We notice. Weconnect the dots. We fix the bug. We're just doing it with log files and dashboards, instead of magnifying glasses and fingerprint dust.
The criminals might be bugs instead of burglars, but our brains? They're still running the same detective software they always have. And that's exactly what makes observability work.
Ultimately, our core function remains investigation. We observe, we analyse, we connect the pieces, and we solve the puzzle.
Frequently Asked Questions
Why are traces important in distributed systems?
Traces map a single request's journey across services, identifying where time is spent, failures occur, and components interact. This correlation is vital when a user action engages multiple independent services.
Do I need all three pillars for useful observability?
No. Many teams start with structured logging, then gradually add metrics and traces. Each pillar offers a unique dimension, and even partial coverage enhances diagnostics.
Does observability introduce performance overhead?
Some overhead exists, but modern tools minimise it with asynchronous logging, sampling, and efficient data formats. The diagnostic value generally surpasses the small cost of generating the data.
How does observability change everyday development work?
It reduces debugging uncertainty, shortens root cause identification time, and boosts deployment confidence. It also supports a clearer understanding of system behaviour under load.
What is the best way to start adding observability to an existing codebase?
A practical start is structured logging in critical functions. Consistent identifiers, log levels, and contextual data provide immediate benefits. Metrics and traces can follow as the architecture evolves.
Which tools are commonly used for implementing observability?
Popular options include Pino/Winston (JavaScript logs), Prometheus (metrics), and OpenTelemetry (traces). The choice depends on language, infrastructure, and performance needs.

.webp)

