.webp)

Chukwunonso Nwabueze
Chukwunonso Nwabueze is a Software Engineer passionate about building high-performance applications. He has led engineering teams on several major projects and is passionate about creating solutions that address critical problems with a results-driven mindset.
Article by Gigson Expert
Have you ever dealt with sluggish response time, scalability issues, or cloud bills that look more like rent fees?
These things sometimes happen simply because of memory leaks or CPU-heavy code. Let's go through some examples together.
- The Crashing App on Black Friday:
A shopping app kept adding items to memory without clearing them. On Black Friday, memory maxed out, and the app crashed, costing thousands.
- The Slow Report Generator:
A reporting tool hogged CPU, slowing down the entire application, even for users who weren't using it.
By now, you’ve probably realized how harmful they can be to your Node.js application. That’s exactly why this article exists. We’ll walk through best practices for identifying and fixing them, along with tips for handling CPU spikes in Node.js.
For a production example of this playbook, see how a Gigson engineer took Gerocare from 5-minute loads to 300ms.
Understanding NodeJS Performance Optimization?
Performance optimization refers to the process of improving the speed and overall efficiency of an application. In the context of Node.js, this means ensuring the application can handle increasing load without slowing down. Optimization in Node.js or any backend technology often focuses on minimizing resource consumption, reducing latency, and maintaining solid performance even as the number of requests or the complexity of tasks increases.
Now, take note that effective optimization can make your application more reliable and able to handle increasing requests without slowing down. Here are some of the most frequent performance problems encountered in Node.js applications.
- Memory Leaks: Memory leaks happen when an application holds on to memory it no longer needs. In Node.js, this typically occurs when objects, functions, or event listeners aren’t properly cleaned up. As a result, the app gradually consumes more memory than it should. Over time, this can slow down performance, exhaust available memory, and even cause the application to crash.
- CPU-intensive tasks: CPU-intensive tasks are operations that require a lot of processing power from the CPU, like complex calculations and data processing. Since Node.js runs on a single thread, it can have trouble handling these tasks efficiently. In a situation where the event loop is blocked by CPU-intensive operations, other asynchronous tasks in the system can be delayed, causing slower performance for users.
- Blocking I/O Operations: Although Node.js is built to handle I/O operations, blocking I/O operations can still happen. This occurs when operations are performed synchronously, meaning they stop everything else from running until they are finished. For example, if the app is waiting for a file to be read or a database query to complete, it can’t process other tasks during that time. As a result, this can cause slower response times and reduced overall performance.
Since this article focuses on memory leaks and CPU profiling, I’ll keep the explanations concise and centered on these core topics.
How to Detect Memory Leaks
Detecting memory leaks in Node.js can be tricky, but the right tools make the process much more manageable. Here are some common methods for identifying them:
- Profiling Tools: Node.js provides built-in profiling tools like node-- inspect to analyze your application’s memory consumption. By running your app with these tools, you can track memory usage and pinpoint areas where memory is not being released properly.
- Monitoring Memory Usage: Using monitoring tools like clinic.js or pm2 can help track memory usage over time. These tools can alert you to abnormal memory growth, which might indicate a memory leak.
How Heavy CPU Work Slows Down Node.js
Node.js is designed for non-blocking, I/O-heavy operations. Because it runs on a single thread, it can struggle with CPU-intensive tasks, like complex calculations or image processing. When such tasks take over the thread, they block the event loop, preventing other operations (like handling requests) from happening smoothly. This leads to slow response times and poor performance.
When Should You Profile?
CPU profiling is useful when:
- Your app feels slow, even though you're not doing heavy I/O.
- You suspect long-running functions are blocking the event loop.
- You're optimizing performance-critical code paths like parsing, sorting, or data transformation.
Tools for CPU Profiling
Some of the widely used CPU profiling tools are:
- Chrome DevTools: With the-- inspect flag, you can connect your Node.js app to Chrome DevTools and view the performance profile.
node --inspect app.js- Clinic.js: A powerful profiling tool that helps you diagnose performance issues with flame graphs and insights.
npx clinic doctor -- node app.js- 0x: Generates Flamegraphs from your app’s CPU usage, which visually show where the app spends the most time.
npx 0x app.jsNote: Flamegraphs are a way to visualize where your program spends most of its time.
Let’s go through how to spot and fix a performance issue in a Node.js app. We'll simulate a small memory leak, profile it, and fix it.
Create a Simple App with a Memory Leak
Note: For this demonstration, I’ll be using Windows, and the Chrome browser version might differ slightly.
- Start by writing the JavaScript code below.
// leak.js
const leaks = [];

function leakMemory() {
  const large = new Array(1e6).fill("leaky");
  leaks.push(large);
}

setInterval(leakMemory, 1000); // Leaks memory every second
console.log("Leaky app started on PID:");
This script keeps adding data to an array without clearing it, and makes the memory keep growing.
- Run the App with the Node inspector and profiling:
node --inspect --cpu-prof leak.jsThen open Chrome and go to chrome://inspect
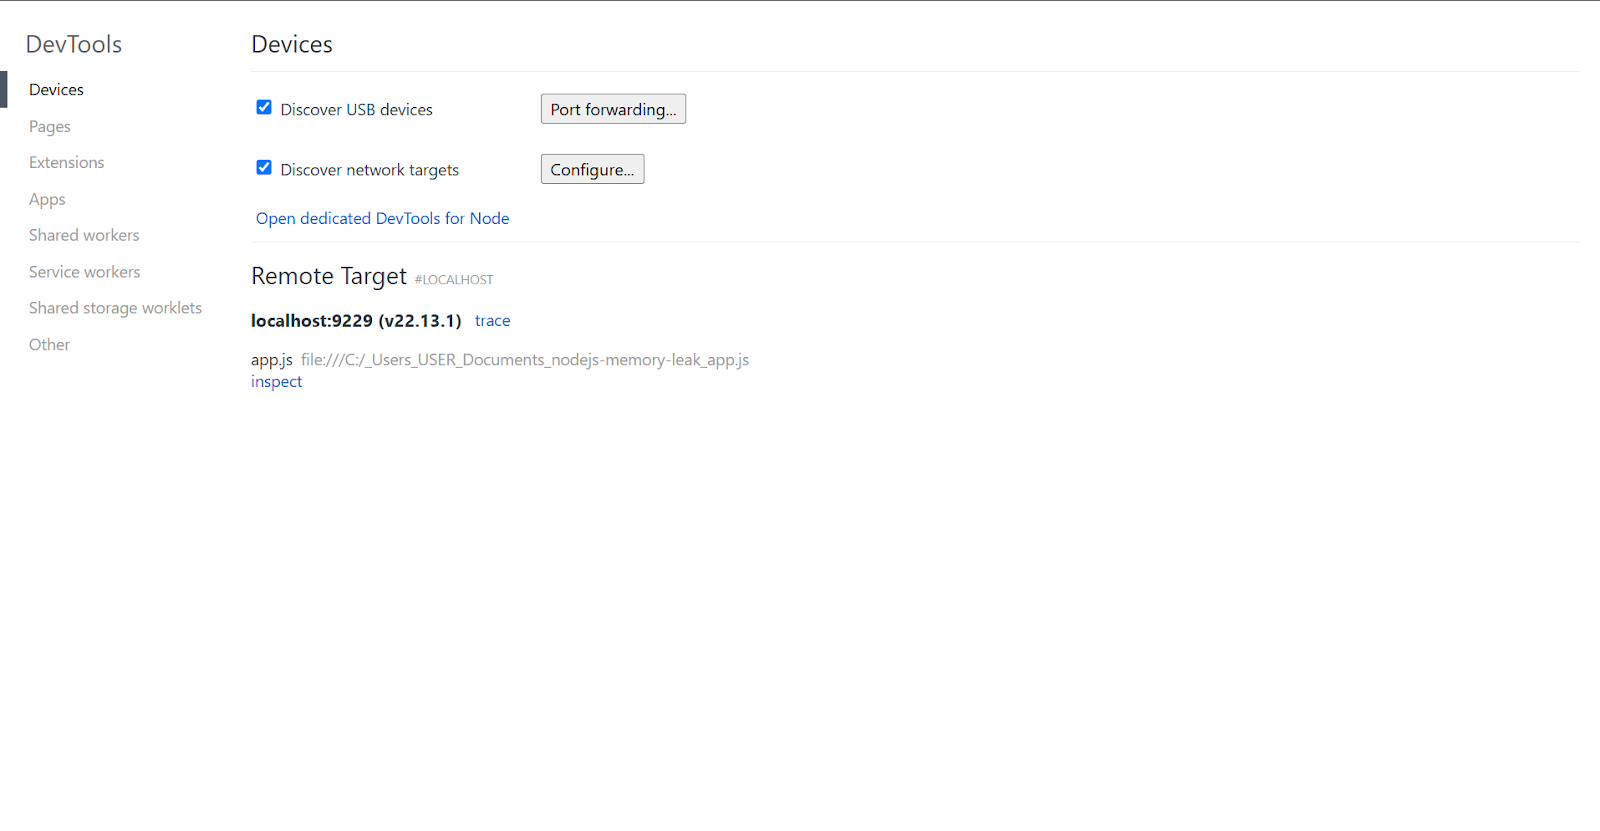
Click “inspect” under Remote Target.
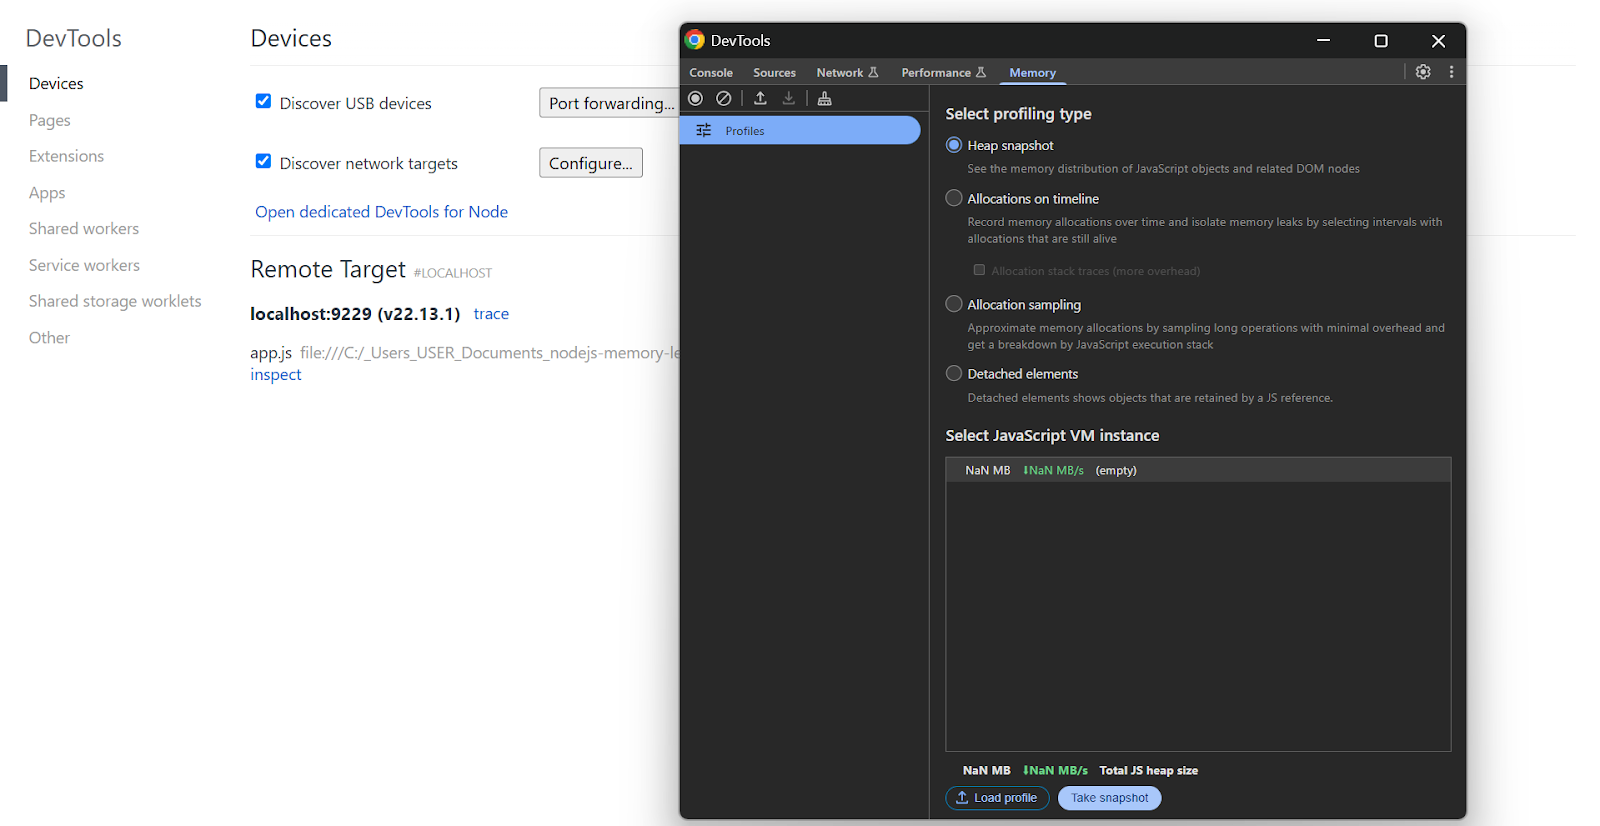
Once you see the devtools pop-up, click on → Memory tabs.
- Take a heap snapshot right after the app starts.
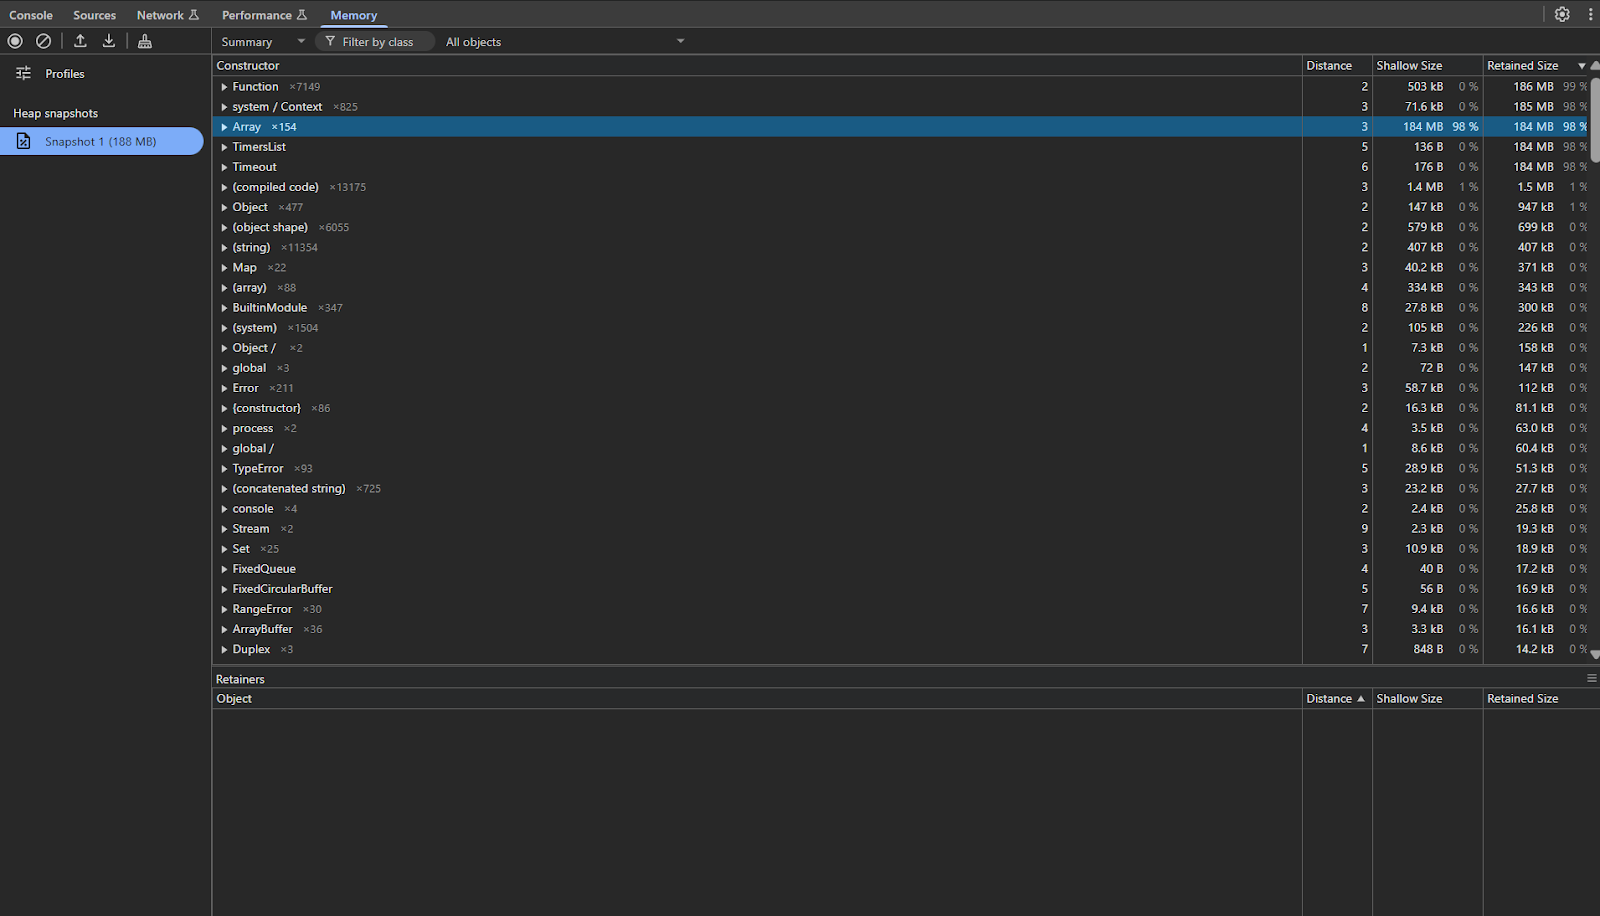
- Wait 20–30 seconds and take another.
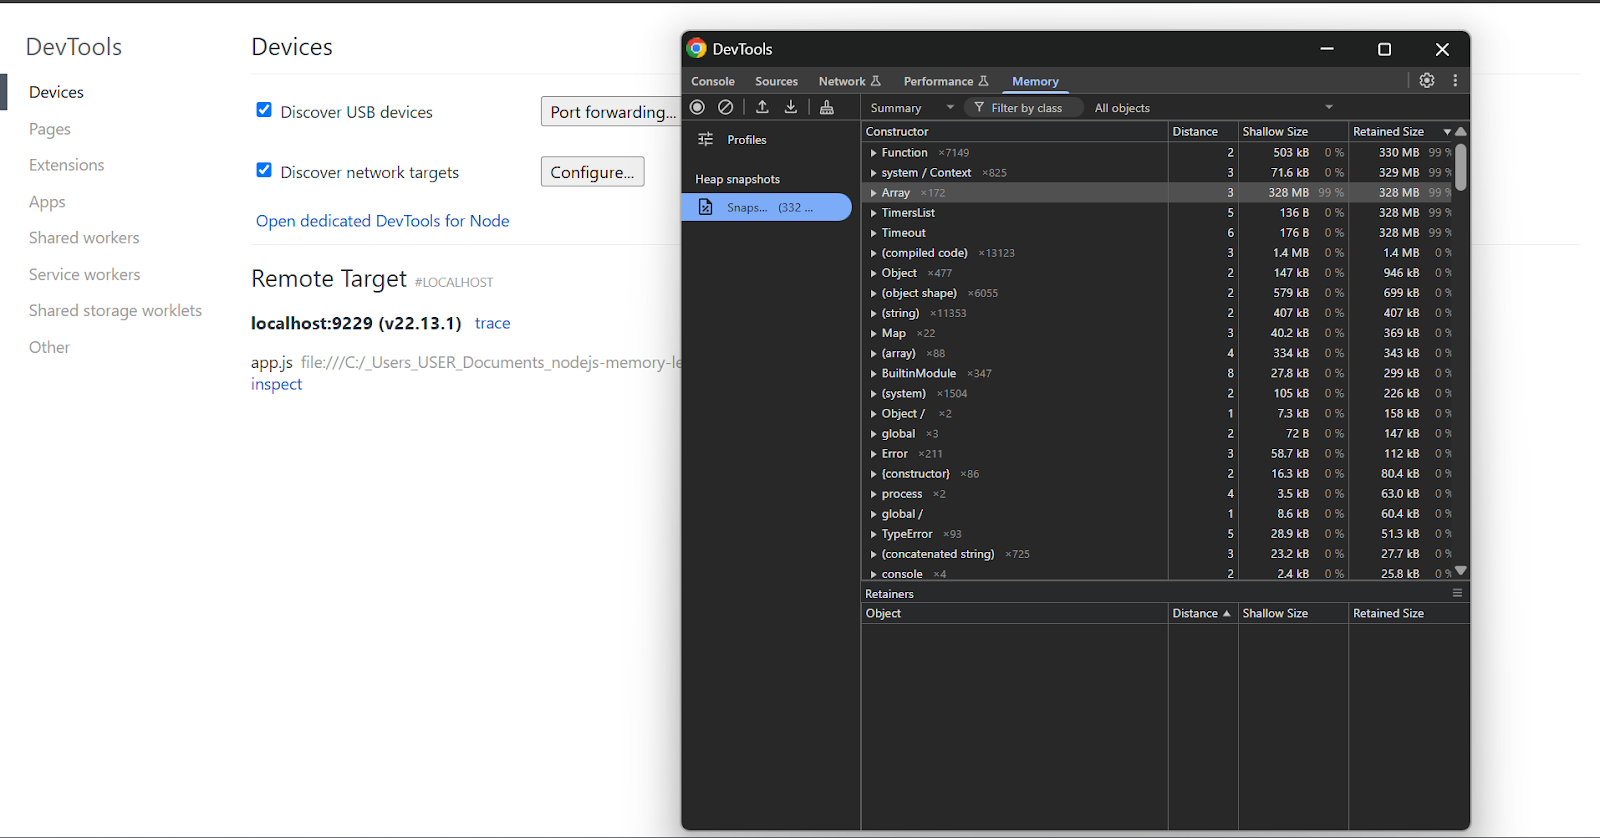
You’ll notice that memory usage keeps increasing because some arrays are not being cleared
Here’s a simple fix: clear old data so it doesn't keep growing:
const leaks = [];

function leakMemory() {
  const large = new Array(1e6).fill("leaky");
  if (leaks.length > 10) {
    leaks.shift();
  }
  leaks.push(large);
}
Best Practices
To prevent and manage performance issues effectively, you need to
- Avoid Blocking Code
Synchronous functions can block the event loop and slow down your app. If you're writing a function that might take a while to complete, like reading a file or making a request, it's better to use an asynchronous version instead.
fs.readFile('file.txt', (err, data) => { ... });- Monitor Continuously
Continuous monitoring is essential to catch memory leaks, CPU spikes, or unexpected bottlenecks in real-time. Use tools like Node.js built-in process module, Chrome DevTools, clinic.js, or New Relic to track memory usage. Monitoring also provides valuable insights into how your app performs in production, helping you make informed optimization decisions over time.
Conclusion
Now that you have a solid understanding of memory leaks and CPU profiling, it’s time to put this knowledge into action. Try using these profiling tools (Clinic.js, New Relic) on your current project and compare memory snapshots before and after deployment. Regularly monitoring your app’s performance will help you stay ahead of potential issues and keep your users happy. Take proactive steps to optimize your Node.js app today!

.webp)